|
|
||||||
|
|
|
|
Download | |||
Diamond Version 5 User Manual: Distances and anglesDistances around a selected atomThis article in brief:
Previous article: Table of distances and angles OverviewThe Properties view (or "properties pane"), which is by default placed in the bottom right of the Diamond document window, offers several informations in context with the current situation, e.g. the contents of the structure picture you are working with, properties of the selected atom and many more. The Properties view is described in general in the article "Data Pane: Data sheet, tables, properties view, and atom list". The information types can be chosen from the dropdown list below the properties pane's title bar. Here we have a closer look to the information types dealing with interatomic distances: Distances around selected objects Distances between selected atoms Histogram of distances
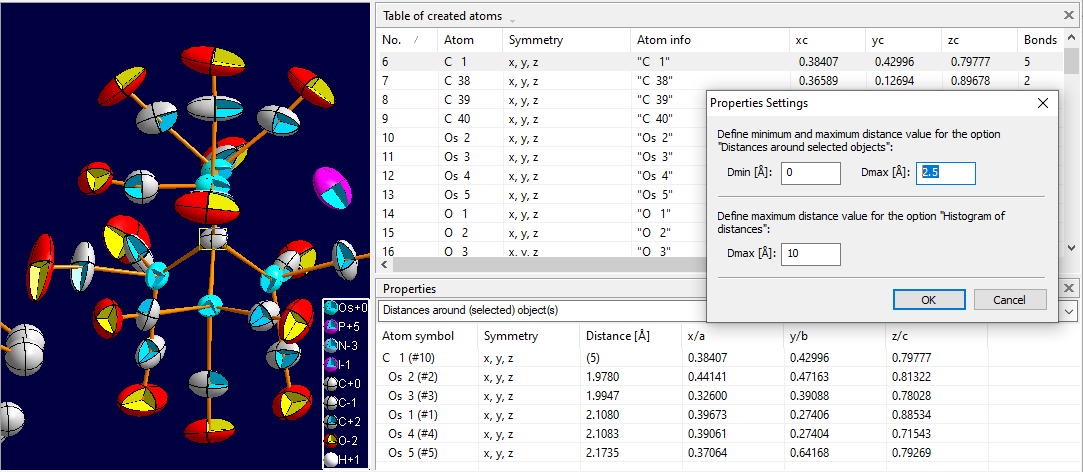
Distances around selected atomsTo see a table of distances around a (central) atom, choose the option Distances around selected object(s) from the combobox below the properties pane's title bar. The results you see depend on, if the structure picture pane left beneath the properties pane or the table above the properties pane has the input focus (this is usually done with a mouse click into the pane) and if and how many objects are currently selected in the pane. The screenshot below shows the atom "C1" selected in the structure picture of the compound [1] and in the table of created atoms. Since the selection of atoms in the table of created atoms is automatically synchronized with the selection of atoms in the structure picture, the reference (i.e. central) atom is the same in the distances table in the properties pane. The distance range has the default size of up to 2.5 Å. The Properties Settings dialog has been opened through the corresponding command of the properties pane's context menu.
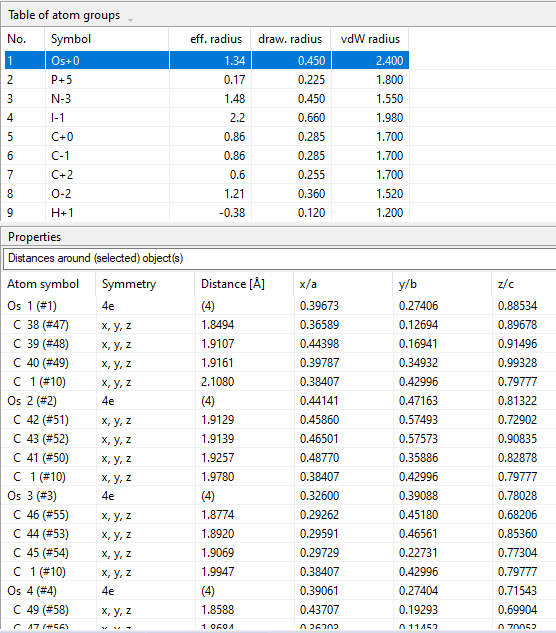
This works similar for the table of atomic parameters and the table of created polyhedra. In the first case the (asymmetric) atom from the parameter list is taken as central atom for the distance calculation, in the second case the central atom of the polyhedron. In any case, if N atoms are selected in the structure picture and/or in the table, there are N central atoms in the properties pane, each with a list of its neighbouring atoms. If the table of atom groups or the table of bond groups is in use, all atom sites belonging to the currently selected atom group or belonging to the atom groups belonging to the selected bond group are regarded as central atoms in the properties pane. Screenshot with table of atom groups and table of distances with central atom sites belonging to the selected atom group. The screenshot shows all atom sites as central atoms belonging to the atom group "Os+0". (All osmium atoms in the atomic parameter list have the oxidation number zero.)
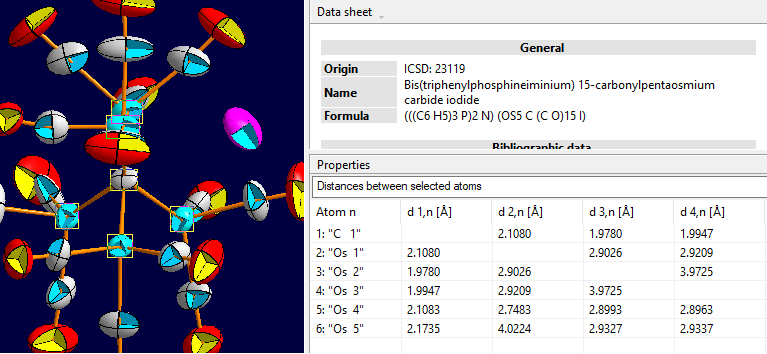
Distances between selected atomsThe properties option Distances between selected atoms shows the distances between N selected atoms in matrix form, as in the following screenshot with the six atoms "C1" and "Os1" through "Os5" selected. (Note that the number of columns is limited to four distance values plus atom number and atom label in the first column.)
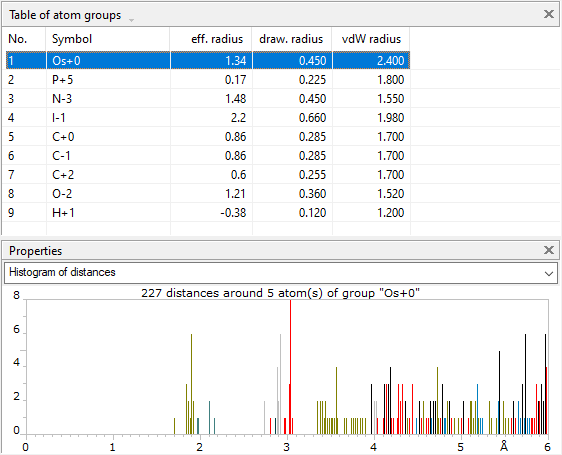
Distances histogramThe distances histogram has already been described in the previous article "Table of distances and angles" as part of the Distances and Angles view below the actual table of calculated distances and/or angles. Here we present the capabilities of the distance histogram depending on the selection in the structure picture or in a data table. In principal there are two types of distance histograms, one to show distances around one or more atoms and one to show distances between two atoms each or the distribution of distances between two types of atoms. To activate this kind of representation, choose Histogram of distances from the dropdown list below the title bar of the properties view. Showing distances around a selected central atom The regular way is to show the distances from one central atom to its neighbouring atoms (up to a maximum distance of 10 Å). This is used in the following scenarios: Showing distances around multiple selected atoms If multiple atoms are selected in the structure picture or in the table of created atoms, the histogram compiles the distances around these (central) atoms. The headline of the histograms informs you about the number of central atoms regarded, e.g. "689 distances around 3 selected atoms". Note: If you mark multiple rows in the table of atomic parameters or in the table of created polyhedra, the histogram refers only to the central atom associated with the atom/polyhedra that has the focus (indicated by a dotted rectangle). Showing distances around atoms of a selected atom group If you use the table of atom groups, the histogram regards all atom sites as central atoms that belong to the selected atom group. (If multiple rows are selected, only the focused atom group is regarded.) In the screenshot below the atom type "Os+0" is selected in the table of atom groups and the histogram shows all 227 distances around all of the five atom sites belonging to the atom group "Os+0". Here we use a maximum distance of 6 Å.
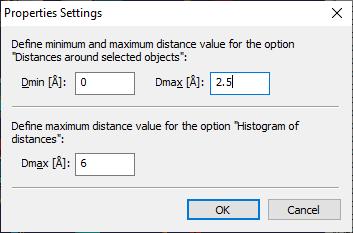
Showing distances between all atoms belonging to a bond group If you use the table of bond groups, Diamond regards all interatomic distances between atom sites belonging to the selected pair of atom groups, i.e. "bond group". So the headline in the histogram may read e.g. "86 distances between atoms of groups 'Os+0' and 'C+2'", if you select the bond group "Os+0 --- C+2". This is the same kind of histogram that you may already know from the Bonds page of the Connectivity dialog that shows all distances for a selected bond group, i.e. pair of atom groups. Showing the distribution of bond lengths If you select one or more bonds in the structure picture or in the table of created bonds, each of these bonds is represented by a line in the histogram at the distance position (x-axis) of its bond length in Å. The headline of the histogram may read e.g. "Lengths of 3 selected bonds". Settings for table and histogramThe default values for the distance range used for the table of distances around an atom and for the matrix of distances between atoms is 0 through 2.5 Å. The distance histogram uses 6 Å as default maximum distance. You can change these values by calling the Properties Settings dialog through the corresponding command in the context menu of the properties pane.
(1) Define the minimum and maximum distance value for the options "Distances around selected objects" and "Distances between selected atoms" in the Dmin and Dmax input fields (in Angstroem each), rsp., in the upper half of the dialog. (2) Define the maximum distance value for the option "Histogram of distances" in the Dmax input field (in Angstroem) in the lower half of the dialog.
Previous article: Table of distances and angles
[1] ICSD: 23119. Jackson P F, Johnson B F G, Lewis J, Nicholls J N, McPartlin M, Nelson W J H; "Synthesis of the Carbido Anion (Os5 C (C O)15 I)and the X-Ray Crystal Structures of Os5 C (C O)15 and Ph3 P)2 N) (Os5 C (C O)15 I)"; JCCCA, 1980, 564-566 (1980). |
|
Page last modified October 13, 2023. Copyright © 2023 Crystal Impact GbR. All rights reserved. Contact Webmaster |